

Market Insights:
January 2, 2024
Posted on January 02, 2024
Planning and Guidance, Tailored To Your Life and Goals
Tuesday Takeaway
Posted on June 13, 2022

The BW Team
Date: 6/13/2022
Investing in the capital markets gives us a fighting chance to enjoy a comfortable life and a dignified retirement. But we are faced with a dilemma. We must take risk to meet our financial needs, yet we are psychologically ill-equipped to do so. Our brains have developed over eons with features that can impede good decision making. Ironically, our ancient and powerful survival instincts can sometimes drive poor outcomes in the modern world.
“The investor’s chief problem — and even his worst enemy — is likely to be himself.” – Benjamin Graham
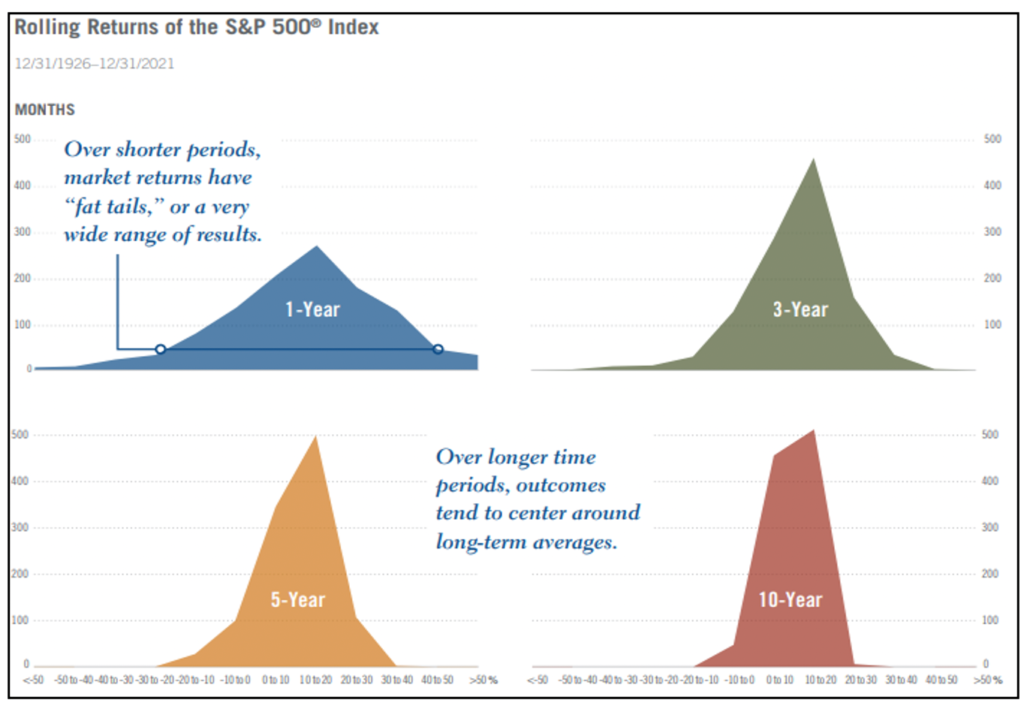
Conventional wisdom says that stocks return “about 10% per year.” There’s a grain of truth to that, but it doesn’t account for what investors really experience in the market. Stocks can be very volatile in the short term, producing large performance swings. It’s only over multi-year periods that the distribution of stock market outcomes narrows and we approach long-term historical averages.
The challenge for investors during a time correction is to exhibit discipline and patience, which we will acknowledge is difficult. Market corrections since 2008 have been followed by fast V-shaped recoveries. This has created an impatient investor class. Since 2008, there have been six declines greater than 10%. In only one instance, from May 2015 to February 2016, did the combined duration of the correction and subsequent recovery to the prior high take more than nine months. The other five instances had a combined duration of less than five months. That is historically abnormal, creating false expectations and impatience when the V-shaped recovery does not arrive. Year to date, the correction and recovery attempt has taken less than five months. That is statistically below even some of the most optimal correction scenarios since 1966. Prudence dictates resetting expectations to prepare for somewhat more of a “time correction” until clarity emerges.
Too many investors focus on “beating the market” or hot investment trends because it’s easier to focus on daily market activity than on long-term goals. Planning requires us to look far into the future, make decisions about the life we want to live, and then step back to allow for the plan to work. Thinking long-term and doing nothing are not easy! Beating an arbitrary index or outpacing other investors is not relevant to achieving the things that really matter to you—a new home, a college education, or a comfortable retirement.
We strongly advocate for the need for education, planning, and advice across an investor’s lifetime. Understanding the ride matters. Stay focused on what matters. And enjoy the ride.
If you have any questions, even just one, no matter how simple, be sure to reach out.
We’ve got a dedicated team ready to help you with just about anything related to your financial plan and investment portfolio.
Let us know what we can do for you.
Team BW
| Index | Week | YTD | 12-mo. | 2021 | 5-yr. |
|---|---|---|---|---|---|
| Dow Jones Industrial Avg. (31,393) | -4.56% | -12.78% | -7.15% | 20.95% | 10.49% |
| S&P 500 (3,901) | -5.04% | -17.60% | -6.66% | 28.68% | 11.88% |
| NASDAQ 100 (11,833) | -5.69% | -27.23% | -14.62% | 27.51% | 16.62% |
| S&P 500 Growth | -5.79% | -26.08% | -11.18% | 32.00% | 13.81% |
| S&P 500 Value | -4.34% | -8.13% | -2.67% | 24.86% | 8.96% |
| S&P MidCap 400 Growth | -5.32% | -20.46% | -15.18% | 18.89% | 7.60% |
| S&P MidCap 400 Value | -4.03% | -9.22% | -6.28% | 30.61% | 8.14% |
| S&P SmallCap 600 Growth | -4.55% | -20.16% | -14.89% | 22.56% | 8.10% |
| S&P SmallCap 600 Value | -4.10% | -9.09% | -10.67% | 30.85% | 7.75% |
| Russell 2000 | -4.37% | -19.41% | -21.26% | 14.78% | 6.15% |
| MSCI EAFE | -4.65% | -15.80% | -16.04% | 11.26% | 3.05% |
| MSCI World (ex US) | -3.41% | -14.35% | -16.80% | 7.82% | 3.44% |
| MSCI World | -4.93% | -17.58% | -10.85% | 21.82% | 8.39% |
| Index | Week | YTD | 12-mo. | 2021 | 5-yr. |
|---|---|---|---|---|---|
| Communication Services | -4.13% | -27.86% | -25.75% | 21.57% | 6.03% |
| Consumer Discretionary | -6.06% | -29.72% | -17.82% | 24.43% | 10.62% |
| Consumer Staples | -2.59% | -6.54% | 5.10% | 18.63% | 8.05% |
| Energy | -0.83% | 61.63% | 68.22% | 54.39% | 11.01% |
| Financials | -6.75% | -16.42% | -11.38% | 34.87% | 8.16% |
| Health Care | -3.38% | -10.64% | 1.59% | 26.13% | 12.16% |
| Industrials | -4.95% | -13.81% | -10.81% | 21.10% | 7.64% |
| Information Technology | -6.37% | -24.84% | -6.83% | 34.52% | 20.42% |
| Materials | -5.77% | -9.52% | -3.15% | 27.28% | 10.61% |
| Real Estate | -6.09% | -20.13% | -7.57% | 46.14% | 8.64% |
| Utilities | -4.09% | 0.42% | 11.50% | 17.67% | 9.46% |
| Index | Week | YTD | 12-mo. | 2021 | 5-yr. |
|---|---|---|---|---|---|
| U.S. Treasury: Intermediate | -1.11% | -6.54% | -7.44% | -1.72% | 0.66% |
| GNMA 30 Year | -1.63% | -8.06% | -8.71% | -1.46% | 0.20% |
| U.S. Aggregate | -1.52% | -10.65% | -10.56% | -1.54% | 0.78% |
| U.S. Corporate High Yield | -2.33% | -10.50% | -8.50% | 5.28% | 2.97% |
| U.S. Corporate Investment Grade | -1.79% | -13.86% | -13.23% | -1.04% | 1.44% |
| Municipal Bond: Long Bond (22+) | -2.57% | -13.54% | -13.19% | 3.17% | 1.55% |
| Global Aggregate | -2.26% | -13.62% | -15.93% | -4.71% | -0.48% |
| Fed Funds | 0.75% – 1.00% | 2-yr T-Note | 3.06% |
| LIBOR (1-month) | 1.19% | 5-yr T-Note | 3.26% |
| CPI – Headline | 8.60% | 10-yr T-Note | 3.16% |
| CPI – Core | 6.00% | 30-yr T-Bond | 3.19% |
| Money Market Accts. | 0.42% | 30-yr Fixed Mortgage | 5.54% |
| 1-yr CD | 1.42% | Prime Rate | 4.00% |
| 3-yr CD | 1.77% | Bond Buyer 40 | 4.39% |
| 5-yr CD | 2.12% |
Posted on January 02, 2024

Posted on December 18, 2023
Posted on December 11, 2023
Posted on December 04, 2023